
We need your help. And, in return, we’re going to make CRS faster for everyone.
Here’s the thing: we’ve been optimizing OWASP CRS for years. We’ve improved detection capabilities, reduced false positives, and added new protections. But when it comes to performance optimization, we’ve been flying blind to a pretty wide extent.
The Problem We’re Facing
How many HTTP headers does a typical request carry these days? What’s the average length of a query string? How many cookies do modern web servers actually receive? What does a normal request body look like in 2025? How large are the JSON files an API gateway faces?
You would think there would be comprehensive research answering these questions. There isn’t. The academic literature on representative HTTP traffic patterns is surprisingly sparse, and what exists is often outdated. We wrote up what we could find in our Dev Retreat 2025 notes, and it’s not much.
This matters because performance optimization without real world data is guesswork. We could accidentally spend weeks optimizing rules for exotic cases that rarely happen in production. Or we could miss obvious improvements because we do not know what “normal” traffic actually looks like.
Our Solution: The Traffic Observation Plugin
So we built a plugin to collect this data. It’s simple, it’s lightweight, and it’s designed with privacy in mind from the ground up.
The traffic observation plugin logs statistical metadata about HTTP traffic passing through your ModSecurity installation. For each request, it captures things like:
- Number of request and response headers
- Information about the number of cookies and the size of the header
- Length of URLs and the query string
- Request and response content types
- Response size
Notice what’s missing from that list: no URLs, no parameter names, no header values, no cookies, no request bodies. Just the statistics: the plugin was designed to extract useful performance data while keeping your sensitive information private.
How It Works
The plugin writes a single log message per request in JSON format (well, almost JSON - ModSecurity has its quirks). Then you run our analysis script, which processes your logs and generates a statistical summary report in JSON.
The report contains aggregated statistics like means, medians, ranges, and standard deviations for each metric. That’s it. No individual requests, no sensitive data, nothing that could compromise your security or your users’ privacy.
Here’s what the output looks like:
...
{
  "NumReqHeaders": {
    "NumValues": 10246,
    "Minimum": 0,
    "Maximum": 20,
    "Range": 20,
    "Mean": 7.09936,
    "Median": 7,
    "StandardDeviation": 4.05312
  }
}
...
This report is safe to share. In fact, we’re asking you to share it with us.
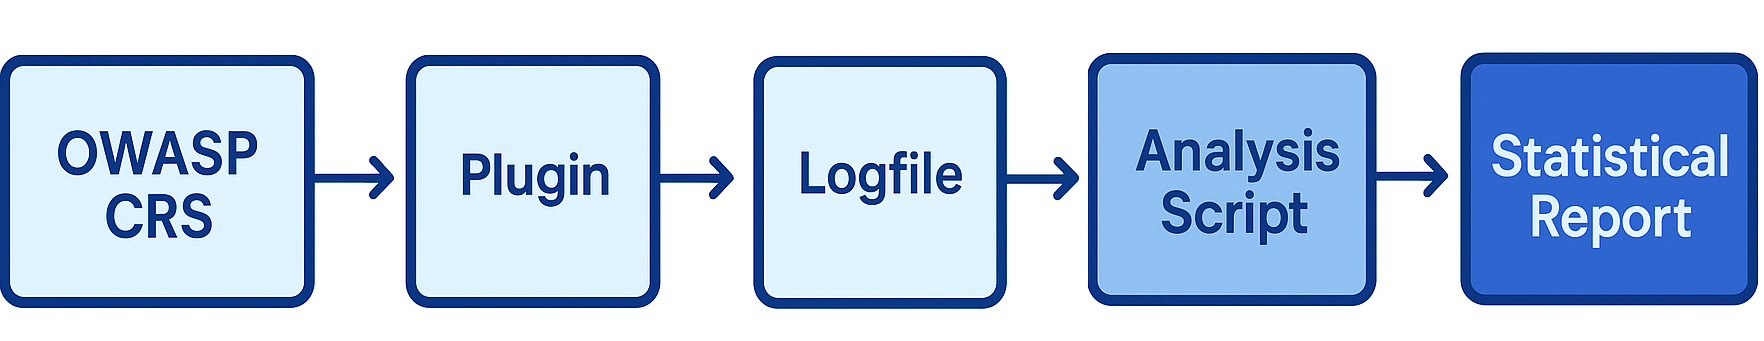
Overview of how HTTP traffic flows through OWASP CRS, the Traffic Observation Plugin, the log file, and the analysis script to produce a statistical report.
Why ISPs and Enterprises Should Care
If you’re running CRS at scale - whether you’re an ISP, a CDN, a cloud provider, or an enterprise with significant web traffic - you’re exactly who we need to hear from.
Large-scale deployments see the kind of diverse, real world traffic that we need to understand. You’re also the ones who benefit the most from performance improvements. Every microsecond we shave off from rule processing multiplies across millions of requests per week, per day, or even per hour. If this applies to you, your traffic patterns matter.
And here’s the thing: the plugin is designed for your use case. For high-traffic environments, there is a sampling mode that lets you log only a percentage of requests. Want to log just 0.1% of traffic? One request in a thousand? No problem. The statistical analysis still works, and the load on your systems stays minimal.
What We’ll Do With This Data
We are building a collection of traffic reports from different environments to understand what modern HTTP traffic really looks like.
This will inform:
- Testing scenarios (what traffic patterns to test against)
- Performance optimization priorities (which rules to optimize first)
- Rule set architecture (we have some advanced ideas in mind, but we need to collect data first)
- Documentation (what performance characteristics users should expect)
- Default configurations (what settings make sense for different workloads)
Every report helps us build a more complete picture. Web applications, APIs, mixed traffic - we need samples from all of them. Different regions, different industries, different scales. The more diverse the data, the better we can optimize CRS for everyone.
And a diverse set of traffic would also help to reduce the biases introduced by a few individual stakeholders. There is a substantial danger that the active developers influence the priorities here in the absence of better data. So far, there is a single statistics report from netnea.com. Let’s not rely on the sparse research literature and that report alone for CRS priorities.
Getting Started
Installation is straightforward. Copy the plugin folder into your CRS4 plugin directory and it’s active by default. Run it for a day, a week, or whatever makes sense for your traffic patterns. Then use our script to generate your report.
You can submit reports via pull request to our traffic-reports folder, or reach out to us directly. We’ve included instructions in the README for generating randomized filenames to keep submissions anonymous if you prefer.
Full documentation is available in the GitHub repository.
This Is How Open Source Works
CRS protects a massive portion of web traffic globally. It’s part of the supply chain for dozens, if not hundreds, of commercial WAF vendors. And CRS is maintained by a handful of volunteers.
That only works because of contributions from the community. Sometimes that’s code, sometimes it’s bug reports, sometimes it’s financial sponsorship. This time, we’re asking for anonymous data.
If you’re running CRS in production, you have information that can help make the rule set better for everyone: including yourself.
So install the plugin, collect some data, and send us a report. It takes an hour of your time and helps us optimize CRS based on reality instead of guesswork.
Let’s make CRS faster together.
 Christian Folini / [@ChrFolini]